Find
IDLE is the new Python development environment which was first released with version 1.5.2 of Python. It is being developed by Guido van Rossum with contributions from among others Tim Peters, Mark Hammond, Moshe Zadka and now Jeremy Hylton.
Its name is an acronym of "Integrated DeveLopment Environment" (although it might also have been influenced by the last name of a certain British comedian from a well known British comedy show). It currently has been tested to work on both Unix and Windows platforms.
It has a Python Shell Window, which gives you access to the Python interactive mode. Its File Editor lets you create new or browse through and edit existing Python source files. There is a Path Browser for searching through the path of available module source files as well as a simple Class Browser for finding the methods of classes. It has a flexible search capability through its Find in Files dialog that lets you search through your files and/or the systems' files to find occurrences of identifiers or any other text fragments. Finally (although this is still is in the process of maturing), it has a Debug Control Panel which provides for the symbolic debugging of Python programs.
Installing and Starting IDLE
IDLE 0.4 came bundled with the Python software release. It was automatically installed when you installed Python 1.5.2. You just had to remember to answer yes when asked if you wanted to install Tcl/Tk (as this is necessary for IDLE to run).
However, the IDLE 0.5 version will be described here (see the version of this document for IDLE 0.4 for its description). IDLE 0.5 can be downloaded from:
IDLE download page
This decompresses to an "idle" directory. You can use this as a direct replacement for the previous IDLE 0.4 version. For example on Windows, you can move:
C:\Program Files\Python\Tools\idle
to:
C:\Program Files\Python\Tools\idle4
and move/copy this new idle directory in its place and it will be the IDLE
that is fired up from your Start menu and will run with with
your 1.5.2 version of Python.
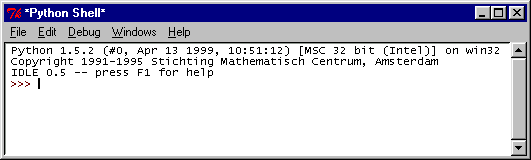
Navigate to the IDLE (Python GUI) entry of the Python 1.5 submenu of the Programs folder of your Start menu and click on it. You can alternatively directly find the "idle.pyw" executable (i.e.in C:\Program Files\Python\Tools\idle) and double click on it. This should bring up the following window:
If the window does not appear, Tcl/Tk may not be properly set up on your PATH. To fix this in Windows 95/98, open up the file C:\autoexec.bat in NOTEPAD and find the line that sets your PATH variable, i.e.:
set PATH=c:\windows;c:\windows\COMMANDAdd ";C:\PROGRA~1\Tcl\bin" to this line i.e.:
Set PATH=c:\windows;c:\windows\COMMAND;C:\PROGRA~1\Tcl\binBe sure to include the single semicolon between what is on the existing line and this new addition. Save the file. You need to shutdown and restart your computer for this to take effect.
In Windows NT, you can modify your PATH through the System Control Panel.
IDLE may also fail to start if you have other Tcl/Tk DLL's in the '\windows\system' directory (i.e. from an older version of Tcl having been installed on your system). Try removing all Tcl and Tk related files from this directory. If you are still having problems see: Tim Peters' Tcl/Tk installation problems post.
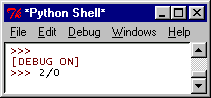
The Python Shell Window provides access to Python's interactive mode. This window will open when you fire up IDLE.
Like the direct interactive mode, you type in a Python statement at the >>> prompt and then hit the Enter key to send it to the Python interpreter. Unlike the regular interactive mode, when in the middle of a multi-line compound statement, no secondary prompt (...) is displayed.
If you ever find yourself in a situation where you seem to be hung and cannot get a new prompt, the interpreter is likely is a state where it is waiting for you to enter something specific (in its parse state). Hitting Ctrl-c will send a keyboard interrupt and should get you back to a prompt. It can also be used to interrupt any running command.
Colorization
Your code is colorized as you type it in based on Python syntax types.
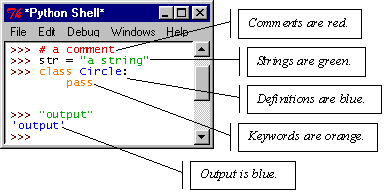
As shown in the above, comments are displayed in red, strings in green, definitions in blue, Python keywords in orange and the interpreter's output in blue.
That is most of what you will normally be concerned with. However, there is further differentiation between different types of output.
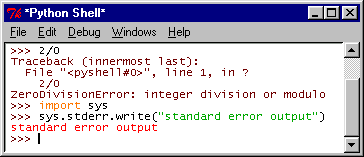
As seen above, console output (i.e. for tracebacks) is brown and standard error output is red.
Indentation
Automatic support for indentation is provided:
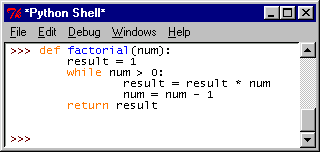
If you type in the above example you will find that when you hit Enter after the def or while clauses, the next line is automatically indented for you (as you enter a new block). When within a block, you will be automatically placed at the same level as the previous statement (above, this happens for the num = num - 1 statement). Finally, each press of the Backspace key will back you out of a level of indentation (above, it needs to be used before the return statement). After a pass, return, break, continue or raise statement you will automatically backed out of a level of indentation.
This is all you will normally be concerned about regarding indentation when in this Shell Window. It is also possible to change the indent level (which defaults here to an eight space tab), as well as indent or dedent (un-indent) a selected region. These commands are described under the Edit a File subsection of the File Editor section of this document (as they are most often used from within the File Editor).
You can move around the buffer using the following key bindings.
| Operation | Unix Key(s) | Windows Key(s) | Menu |
| Move one space left | left arrow key, Ctrl-b | left arrow key , Ctrl-b | - |
| Move one space right | right arrow key | right arrow key | - |
| Move to start of current line | Home key, Ctrl-a | Home key, Ctrl-a | - |
| Move to the end of current line | End key, Ctrl-e | End key, Ctrl-e | - |
| Move up one line | up arrow key, Ctrl-p | up arrow key, Ctrl-p | - |
| Move down one line | down arrow key | down arrow key | - |
| Move up one page | Page Up key | Page Up key | - |
| Move down one page | Page Down key | Page Down key | - |
| Move to the top of the buffer | Ctrl-Home key | Ctrl-Home key | - |
| Move to the end of the buffer | Ctrl-End key | Ctrl-End key | - |
| Center window on selection | Ctrl-l | Ctrl-l | - |
| Find given entry | Ctrl-u Ctrl-u Ctrl-s | Ctrl-f | Edit:Find... |
| Find previous entry again | Ctrl-u Ctrl-s | Ctrl-g, F3 | Edit:Find again |
| Find selection | Ctrl-s | Ctrl-F3 | Edit:Find selection |
| Go to given line | Alt-g, Esc-g | Alt-g | Edit:Go to line |
The Edit:Find function is described in more detail in the Find/Replace section of this document. The Edit:Go to line selection will bring up a dialog prompting for a line number to move to. The rest of these are for the most part self explanatory.
Basic Editing
The following table contain key bindings that can be used for basic editing in the buffer.
| Operation | Unix Key(s) | Windows Key(s) | Menu |
| Delete character left of cursor | Backspace key | Backspace key | |
| Delete character right of cursor | Delete key, Ctrl-d | Delete key, Ctrl-d | |
| Cut selection | Ctrl-w | Ctrl-x | Edit:Cut |
| Paste into the buffer | Ctrl-y | Ctrl-v | Edit:Paste |
| Copy selection | Alt-w, Esc-w | Ctrl-c | Edit:Copy |
| Select whole buffer | Alt-a, Esc-a | Alt-a | Edit:Select All |
| Replace selection | Ctrl-r | Ctrl-h | Edit:Replace... |
| Expand (complete) word | Alt-/ | Alt-/ | Edit:Expand word |
| Previous command in history | Esc-p, Alt-p | Alt-p | |
| Next command in history | Esc-n, Alt-n | Alt-n | |
| Undo last change | Ctrl-z | Ctrl-z | Edit:Undo |
| Redo last change | Alt-z, Esc-z | Ctrl-y | Edit:Redo |
By opening, tearing off and placing the Edit menu on the screen, you can display a list of the key bindings for those of these that are on the Edit menu.
There are some other operations available (i.e. for commenting out, indenting and tabifying regions). However, since these are likely to be mostly used from the File Editor they are introduced in that section of this document.
Any one line Python statement or multi-line compound statement (such as a loop or a function or class definition) can be pasted and entered in its entirety. However, if you paste in a selection containing more than one Python statement, only the first statement will be sent to the interpreter when you press Enter.
The replace functionality is described further in the Find/Replace section of this document
Successive use of the undo and redo function will toggle through undoing or redoing the changes you've made in the buffer.
Word Completion
Typing an Alt-/ calls a word completion mechanism.
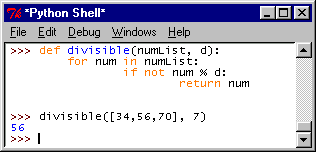
In the above example it is not necessary on the last line to enter in the full word divisible. We are able to just type d followed by Alt-/ and it is completed automatically.
Completion is based on those words that have been previously entered into the buffer. The first response will be the most recently entered word which matches. Successively entering Alt-/ will toggle through any other possibilities. So, in the above example entering an n followed by Alt-/ three times will toggle through num, not and then numList. If we started with nu this would be limited to num and numList.
Command History
Another nice feature that is worth using (because of the amount of typing it can save you) is the command history mechanism.
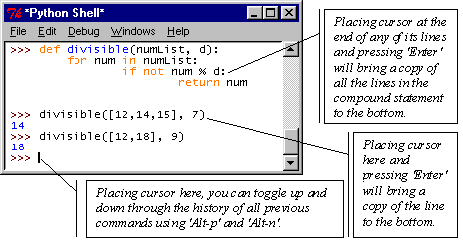
Once you've selected a previous command and brought it to the bottom, either by toggling through them (using Alt-p and Alt-n) or directly selecting it, you can edit it as desired befor hitting the Enter key to have it sent to the interpreter.
Function/Method Call Tips
As soon as you type in the opening bracket for a function or method call a small box will pop up below the current line giving you a "tip" with regards to the arguments that are expected.
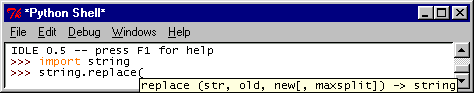
The window stays up until you enter the closing bracket. This occurs for built-in functions, any functions or methods (including class constructors) from Python's library modules as well as for any function or methods defined by yourself. It does not, however, occur for list, tuple or dictionary methods.
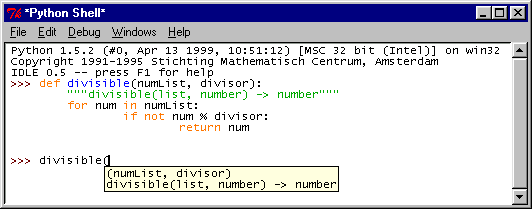
For the functions or methods that you define, the tip will give the names of the parameters you define. As shown above, the first (summary) line of the function or methods document string will also be displayed. This can be used to give information on the types of the arguments and return value.
Special Issues
IDLE's Shell Window exhibits some behavior that differs from that obtained by using the interactive mode directly. First, as mentioned already, you can only paste a single Python statement at at time into it. Redirecting standard input and standard output will not always work in the same way. Finally, as a result of the way the Tkinter event model is set up, the use of a Ctrl-c will not always stop the execution of a code segment. You can always use the interactive mode directly in those situations where these differences are an issue.
Since IDLE is still quite new and still in the process of maturing, there may be times when using some of the other windows in IDLE that you find standard error output directed into your Shell Window. This will normally not effect you beyond having to hit the Enter key to get a new prompt.
If you are typing in a Tkinter example, omit adding the final "mainloop()" line that would be necessary if running from the command line. This can cause your whole IDLE session to hang as IDLE is already running in a Tk event loop.
Finally, if you close the Shell Window without exiting IDLE (i.e. when you have other windows open) and then open a new Shell Window up, you will need to both import and reload any module that you have already imported to pick up changes that you've made to it on disk. To get the behavior of an intial start up, exit IDLE entirely (using Exit on the File menu).
Using the File Editor
IDLE's File Editor allows you to create new or browse and/or edit existing Python source files.
Open a File
The File Editor can be brought up in a number of different ways.
| Operation | Unix Key(s) | Windows Key | Menu |
| Open new window | Ctrl-x Ctrl-n | Ctrl-n | File:New |
| Open existing file | Ctrl-x Ctrl-f | Ctrl-o | File:Open... |
| Open module | Ctrl-x Ctrl-m | Ctrl-m | File:Open Module... |
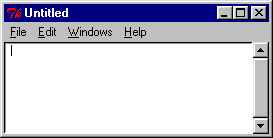
New will open an empty window (i.e. for when you want to start creating a Python source file from scratch). Open lets you navigate to and open any file on your hard drive while with Open Module you only need to enter the name of a module file (i.e. shelve or shelve.py) that is on your module search path (sys.path) and it will find and open it for you.
The File Editor may also be brought up from the Path Browser or when you are using the Debugger (as is described later in this document under those headings).
In all cases, a new File Editor window will be opened with the name of the file and the path to it as its title (or called Untitled if its a new unsaved file).
You can type into this window and the code you enter will be colorized as it is in the Shell Window. Similarily, automatic indentation again occurs. However, here indentation levels will be at four space intervals (as that is the standard for Python source files) while the Shell Window indent level is a tab. All the operations and key bindings to move around and edit in the buffer which are described in the Shell Window section of this document apply here as well (including cut, copy, paste and word completion).
There are also a number of editing operations available that weren't introduced in the Shell Window section (as they are more often used in this window). These work on selected regions of your file:
| Operation | Key | Menu |
| Indent region | Ctrl-] | Edit:Indent Region |
| Dedent (unindent) region | Ctrl-[ | Edit:Dedent region |
| Comment out region | Alt-3 | Edit:Comment out region |
| Uncomment region | Alt-4 | Edit:Uncomment region |
| Tabify region | Alt-5 | Edit:Tabify region |
| Untabify region | Alt-6 | Edit:Untabify region |
| Format selection as a paragraph | Alt-q | Edit:Format Paragraph |
The indent functions are obviously useful when adding or removing nested constructs from your code. The Tabify region function converts leading spaces in a line to tabs (8 spaces to a tab). The Untabify region function converts all tabs in the region to the correct number of spaces. These along with the indent functions are useful for converting to a standard format source code that has be been copied in from various sources such as documents and web pages. The Format Paragraph function performs the function similar to the Emacs fill-region command and is useful within documentation strings.
It is also possible to modify the type and width of the automatic indents.
| Operation | Unix Key | Windows Key | Menu |
| Toggle tab usage | Alt-t | Alt-t | Edit:Toggle Tabs |
| Change indent width | Alt-u | Alt-u | Edit:New indent width |
If Tabs is toggled on, the indentation is created using a mixture of tabs and spaces to obtain the given width. If it's toggled off, only spaces are used. In the File Editor window, the default settings are for Tabs to be off and the indent width to be four spaces. In the Shell window Tabs is on and the indent width is eight spaces (thus the identation is obtained using a single eight character tab).
Save a File
If the title of a buffer is delimited by *'s, this indicates it has changed since the last time it was saved to disk. There are three commands for saving a file.
| Operation | Unix Key(s) | Windows Key | Menu |
| Save | Ctrl-x Ctrl-s | Ctrl-s | File:Save |
| Save as | Ctrl-x Ctrl-w | Alt-s | File:Save As... |
| Save Copy As | Ctrl-x w | Alt-Shift-s | File:Save Copy As... |
The first two are the standard "save to the existing name" and "save (possibly) to a new name". The third is the same as the second, except that it doesn't rename the buffer and tie it to the new file name.
Run a File
You can develop a module incrementally by first importing and then subsequently reloading it into the Shell Window to test it as you make changes. This can be done by using import or reload from within the Shell Window or by using the Import module command from the File Editor itself.
| Operation | Key | Menu |
| Import/reload module | F5 | Edit:Import module |
| Run as a script | Ctrl-F5 | Edit:Run script |
The Import module function will import or reload the module and send you to the Shell Window (opening it if necessary).
Another option for development is to instrument your code with a function to perform the testing you desire and use the Run script command. The output is again sent to the Shell Window. However, it is run as a script (i.e. with __name__ set to __main__ rather than the name of the module).
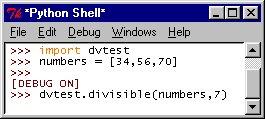
Using the Run script command on this brings up the following in the Shell Window.
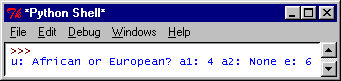
This allows you to work in a tight cycle of "make changes to your code", "hit Ctrl-s" (to save your changes), and then "hit Ctrl-F5" (to view the results).
You can of course also test files that are being developed to actually be scripts in this way as well. You can't currently set command line options and parameters when you invoke the Run script command. However, during development you can always instrument your code with a simple test function that sets sys.argv to any desired value (simulating a command line invocation) before calling your regular top level script function.
With the ability to incrementally develop your programs and to quickly test code segments in the Shell Window you may find your self making less use of a symbolic debugger than you may be used to when working in other languages. However, there are times and situations where it can be very useful. The symbolic debugging mechanism is described in a later section of this document.
Also, if you are developing a Tkinter application, remember to comment out the "mainloop()" call while you are using it from within IDLE.
Using the Find/Replace Dialogs
These dialogs are fairly straightforward but worth quick introductions
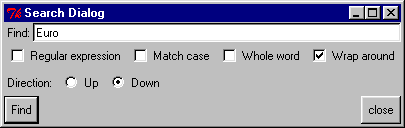
Find
The Find... option on the Edit menu brings up the above dialog box. The default settings are down and Wrap around which means the buffer is searched down from the current cursor position, and if the end is reached before the entry is found the search continues from (wraps back up to) the top of the file. If the regular expression option is set your entry is read as a regular expression. The Match case and Whole word options work as you would expect.
Replace
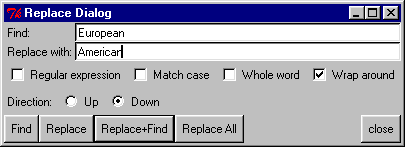
The Replace... option on the Edit menu brings up the above dialog box. This is similar to the Search Dialog but with the addition of the Replace with entry box and the four buttons at the bottom right. These are straightforward.
Find in Files
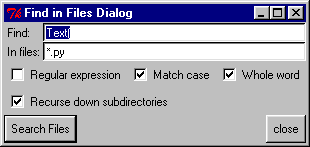
The Find in Files... option on the Edit menu brings up the above dialog box. If brought up from the Shell Window (like this one was), the default is to search all *.py files in all directories on the Python search path. If started from the File Editor, the default will be to search the directory where the file being edited resides and all subdirectories of it. You can set the directory manually and by clearing the Recurse down subdirectories option limit the search to a single directory.
This function can be used to find where a function class or method is defined and/or to find examples of where it has been used in the system library or your own code. The above example finds the definition and some places where the Tkinter Text widget is used. The occurrences that are found are listed in an Output Window.
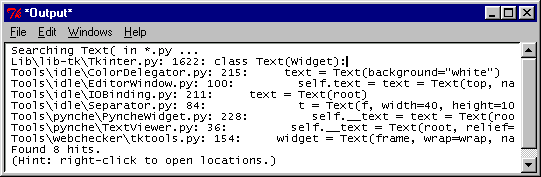
You can open a File Edit window for the file and at the location of any one of these occurrences by right clicking anywhere on its line in this window.
Using the Path Browser
The Path Browser allows you to search through the directories of modules in the Python system path.
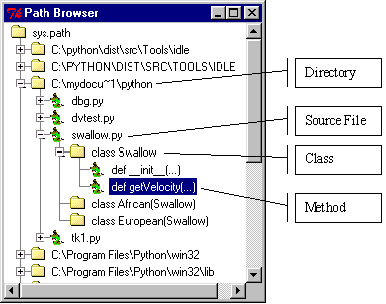
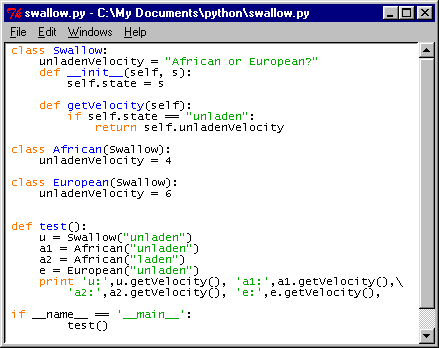
Double clicking on a directory brings up the list of modules. Double clicking on one of these (i.e. swallow.py above) will bring up that file in a File Editor window as well as display the list of classes in that file. Double clicking on one of the classes (i.e. Swallow above) will bring up the list of methods defined for that class (as well as move you to the start of the definition of that class in the File Editor window). If you double click on a method, the File Editor will be brought up positioned at the method's definition. You can also single click on the desired "+" at the left to open up the next level in the Path Browser without bringing up the File Editor window.
Note that on Windows platforms in this release of IDLE (due to a case normalization problem), a number of the directories appear twice in the list.
Using the Class Browser
In this release, the Class Browser is quite basic.
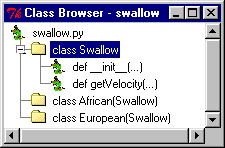
It is fired up from a File Editor window (either using the Class browser option of the File menu or the key binding Alt-c). It initially shows the classes defined in that file (i.e. Swallow, African and European above). The classes a class inherits from, if any, are listed in brackets after the class name. Selecting a class brings up the methods defined "locally" for a class (but not the methods it inherits).
Using the Debug Mechanism
The debugging mechanism in IDLE is still in a process of maturing. For example, in this version the set breakpoint functionality does not work on Windows platforms, limiting its use there. In this version of this document I will just walk you through a brief example introducing the use of the debugger.
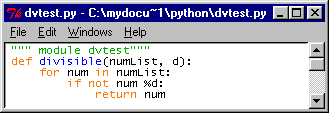
Start by creating and saving the simple module above.
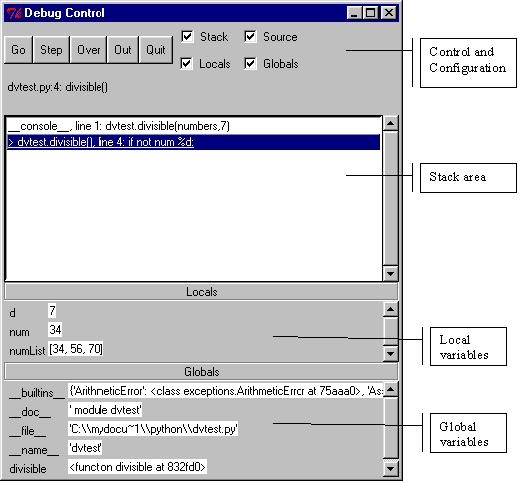
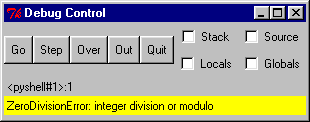
At the top and left of the panel are the five control buttons.
Enabling the Stack setting causes the display of the call stack. In this example we just have two levels. The first is the call from the console to the divisible function and the second indicates the fact we are at the "if not num % d" line in the divisible function.
Enabling he Source setting, causes the display of the line we are at in the current computation (highlighted in blue) in a File Editor Window. It will fire up new File Editor Windows as necessary when functions from new files are entered. In this example we have the single File Editor Window opened for dvtest.py with the current line highlighted.
Enabling the Local setting causes the display of a local variable section on the Debug Control Panel. This display is an alphabetical list of the names and the current values of these variables at this point in the computation. In the above example we have the two parameters numList and d along with the local variable num.
Finally, enabling the Global setting causes the display of a global variable section on the Debug Control Panel. This display is again an alphabetical list. In the above example we just have the four internally variables __builtins__ (which is a dictionary containing such things as the built-in functions and exceptions), __doc__ (set to the module's documentation string), __file__ (the current file) and __name__ (the name of the current module) along with divisible (the name of the only function in this module) . If there were any other functions or any module variables defined in this function they would appear here as well. The numbers variable that was defined in the Shell Window does not appear as Python is statically scoped.
Each of these four settings can be enabled or disable at any time. This will cause the display or removal of the given sections on the Debug Control Panel. In the above example the Global variable list gives us little information, so we would probably disable it to cut down on the clutter.
Status Info
Below the buttons but above the Stack area is a status area that is displayed even if all the settings are disabled. In the above example it showed: dvtest.py:4: divisible(), which indicated we are on the fourth line in the file dvtest.py and in the function divisible. If an exception is encountered it will be displayed below this line and highlighted in yellow. This is seen below where we display the result of first typing 2/0 at the Shell Window and then starting to step through this computation under debug control.
At this point, if we continue stepping through, we would walk through the creation of the traceback that will end up being displayed back to the Shell Window.
Setting Break Points
Setting a break point is a simple matter of, when in debug mode, right clicking on any line of a File Editor Window and selecting the single option "Set breakpoint here". The line will then be highlighted in pink. Execution will stop if this line is reached. Note, however, that in this version of IDLE on the Windows platform this is broken as the debugger will not stop at break points.
Enhancements and Future Development of IDLE
Guido van Rossum and Jeremy Hylton are currently actively working on IDLE. They welcome suggestions and contributions. Discussions on its development direction can be found in the "IDLE-dev" mailing list (
IDLE-dev Mail List).
IDLE has been set up such that you can write your own extensions to it. For Guido's instructions on doing this see: extend.txt.
If you want, you can at any time obtain the latest in-progress version of IDLE. There are two options for doing this. The first is you can get it (along with the latest snapshot of the rest of the Python code) through the CVS tree. The instructions for doing this can be found at: Python CVS Info.
Another option is to make use of the really nice service being provided by David Ascher. He is making a snapshot of the latest version of IDLE available at:
IDLE snapshot.
If you are on Windows, there can be some hitches getting this uncompressed. On my machine the
file:
idle_23_11_99.tar.gz
gets converted to:
idle_23_11_99_tar.tar
and I have to rename it back once it is downloaded (of course the date of
your snapshot will differ). Then you need tools to first uncompress (i.e.
Aladdin Expander on Windows) then detar it (i.e. Winzip on Windows).
What's New in Release 0.5
The new features of this release are:
There will be opportunities for changes as this document will have to be updated for new versions of IDLE. Any feedback you have as to its content or format would definitely be appreciated. I can be reached at ddharms@yahoo.com.Daryl Harms